Speech School
Harmonics
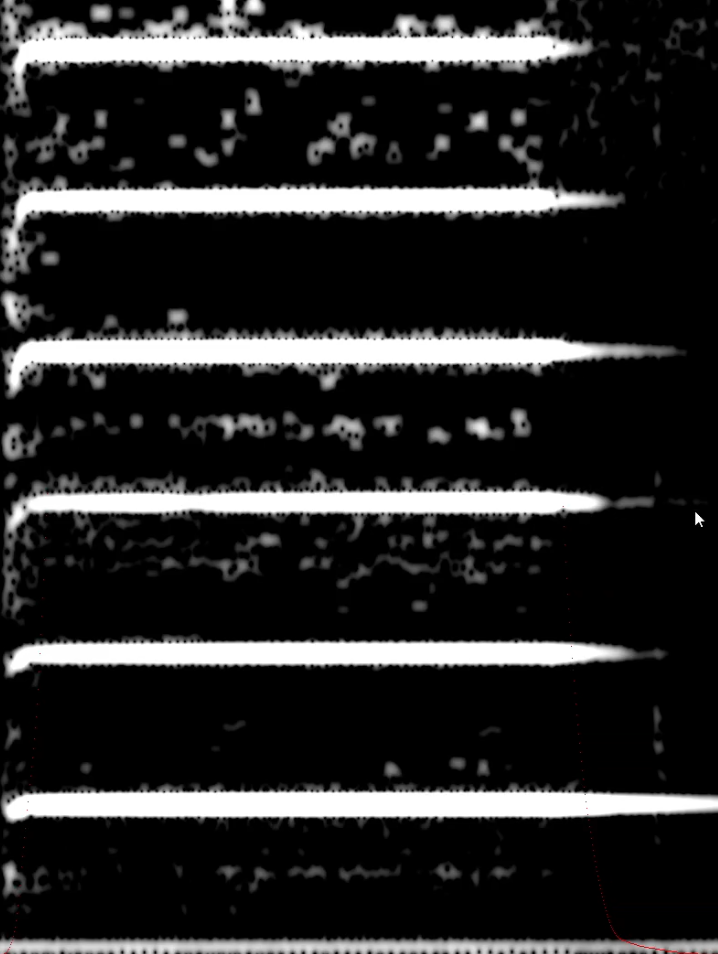
A spectrogram visualizes how the frequencies of a sound change over time.
Time is on the x-axis and frequency is on the y-axis. The color of a pixel shows the magnitude of the frequency for the corresponding time interval. Frequencies with the largest magnitudes are colored white, while those with the lowest magnitudes are colored black.
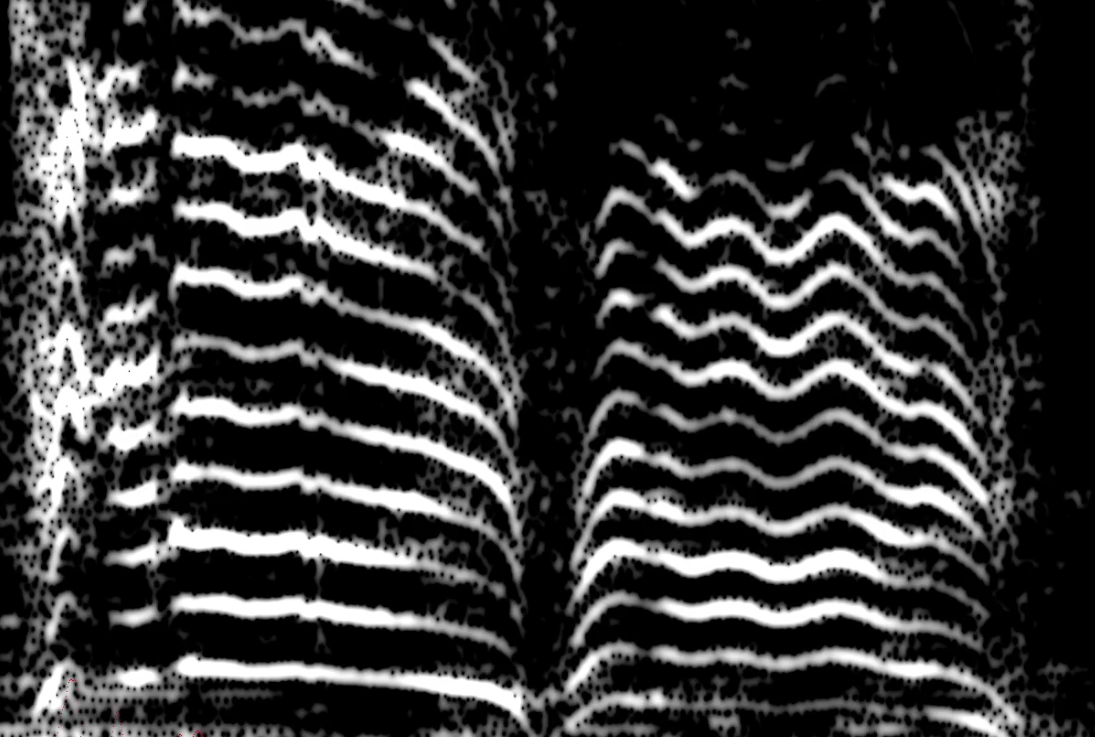
A Spectrogram of the human voice will have equally spaced stripes.
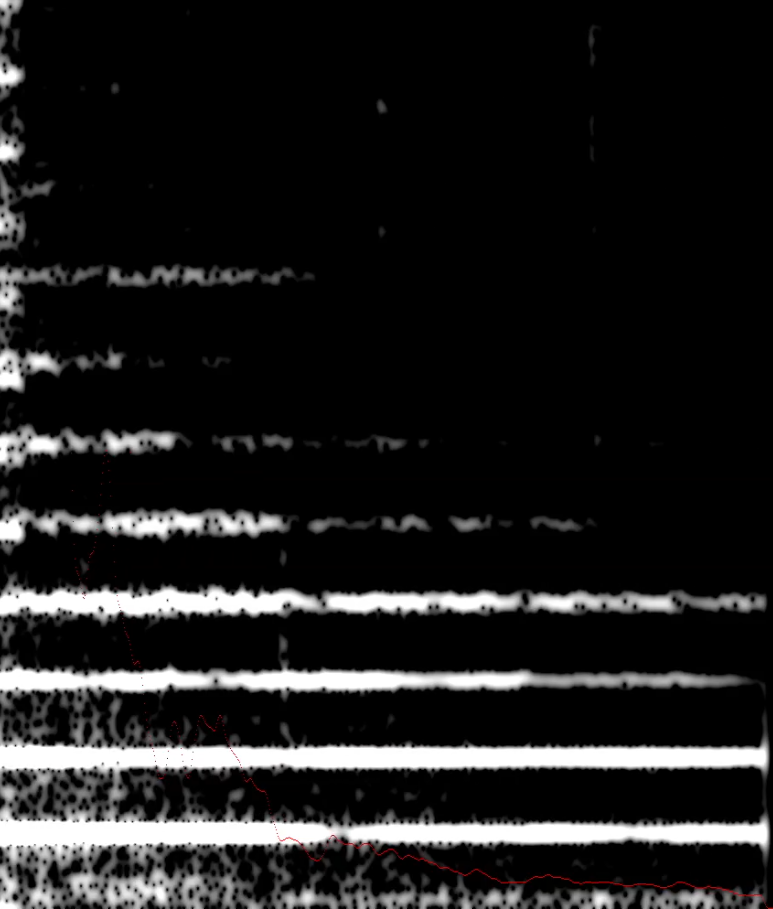
The frequency of the lowest stripe is equal to the pitch, that is the frequency at which the vocal cords oscillate. The other stripes are called the pitch harmonics and have frequencies that are a integer multiple of the pitch frequency.
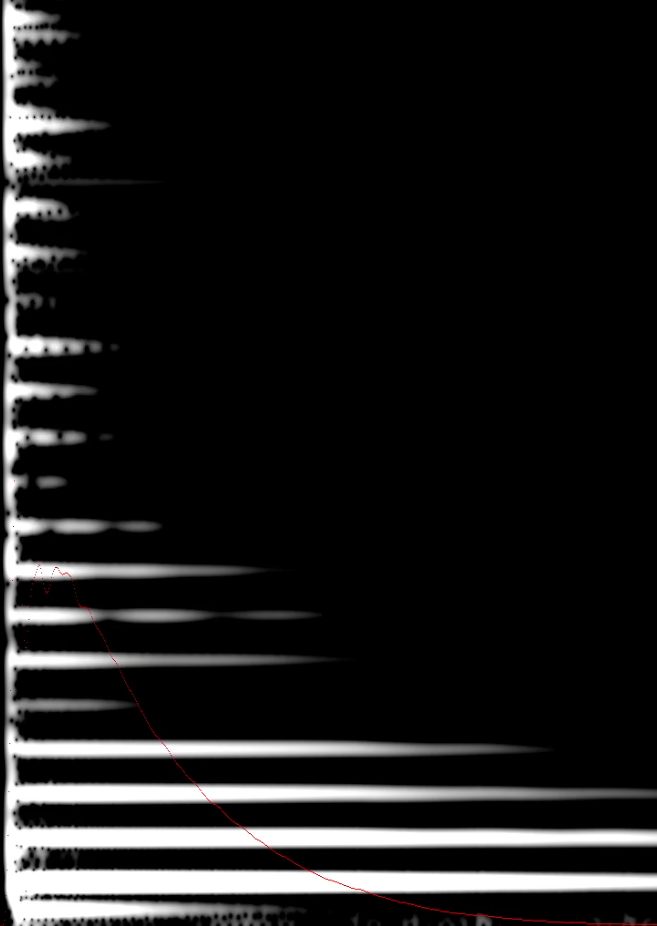
The type of contact the vocal cords make can change how quickly the harmonics dissipate. Usually lower harmonics are stronger but this is not always the case. To get an idea of how the sound source produced by the vocal cords can change have a look at some notes produced by harmonic instruments. The violin is most like the human voice because a violin note is sustained, whereas piano and guitar notes are not and will dissipate. Note that with the quiet violin note the higher harmonics are stronger than the lower harmonics. This is achieved through bowing technique.